The Acute-Phase Problem Inside the Larger Crisis
In our previous article on Permian Basin produced water volumes, we saw daily basin-wide volumes exceed 10.5 million barrels — and still rising.
But inside that massive figure lies a sharper challenge: fracking flowback. This is not just more produced water. It has unique chemistry, extreme volume spikes, and urgent treatment needs. As multi-well pads become standard, flowback is exploding. This article traces how Permian operators have evolved treatment from old open pits to 2026's optimized polymer systems.
Era 1: The Open Pit Era (Pre-2008)
In the late 1990s and early 2000s, flowback management was basic: dig an unlined earthen pit next to the well, route everything in, and let evaporation handle it. West Texas sun did the job — at nearly zero cost.
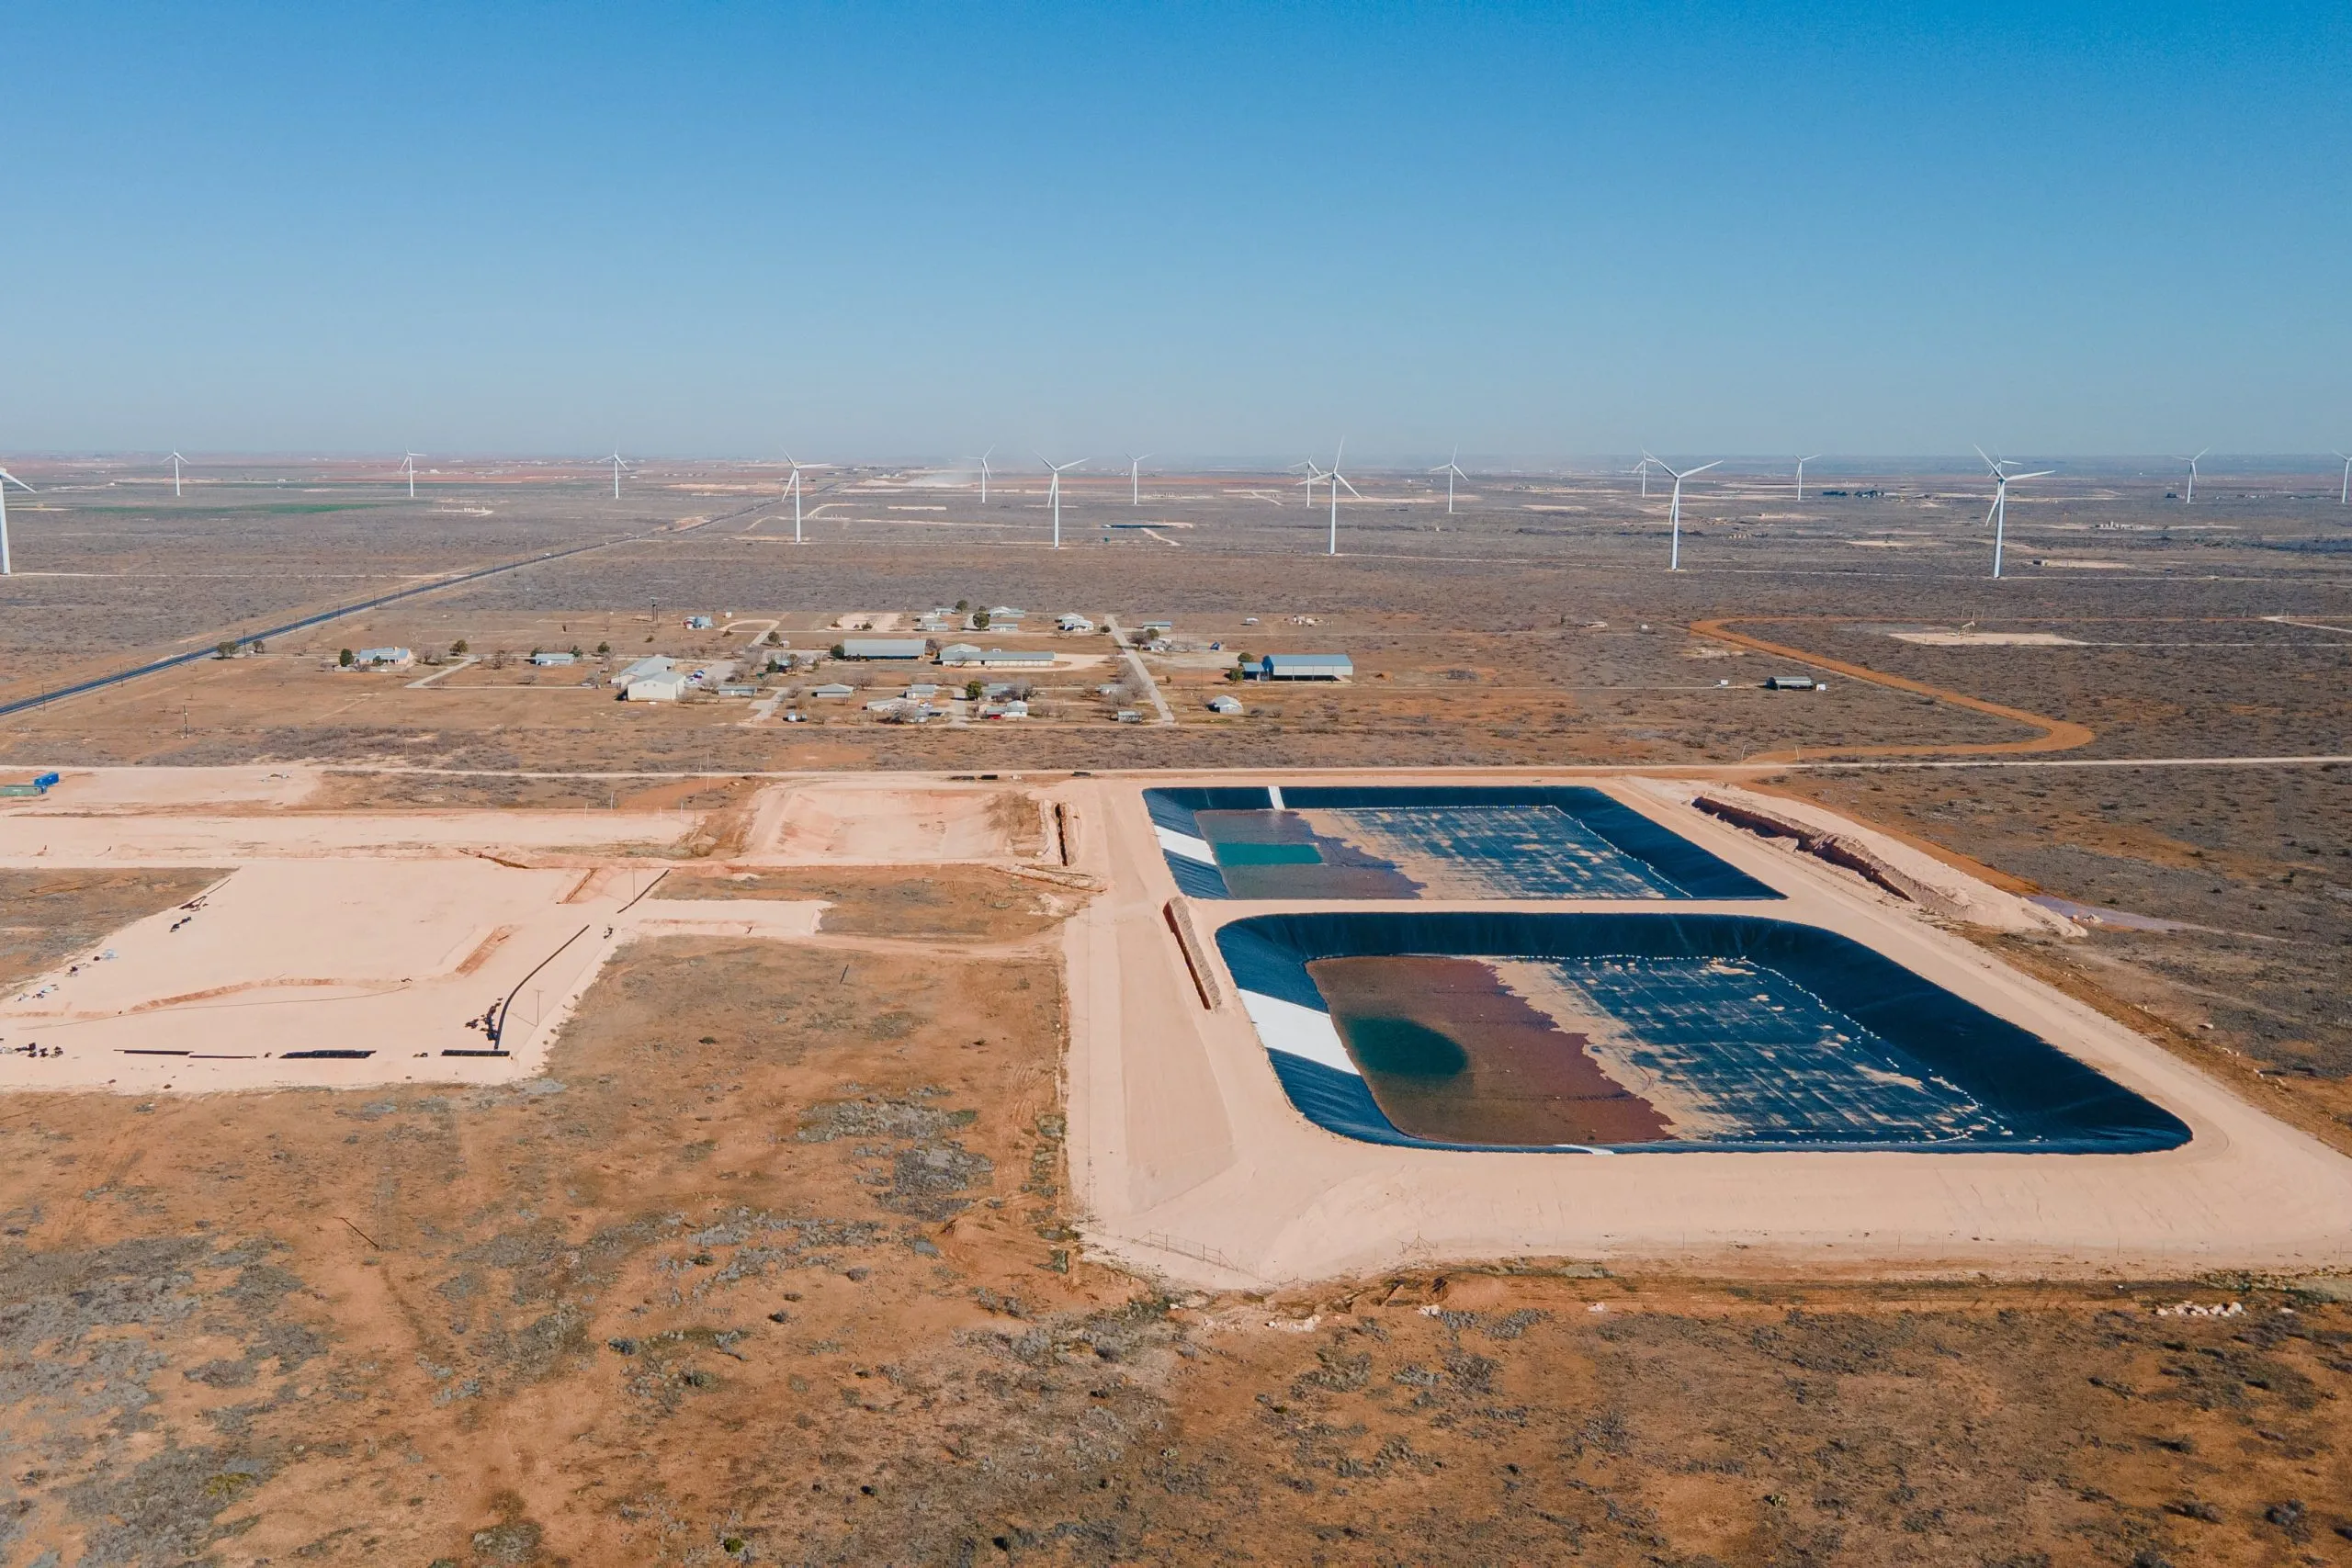
But risks were massive: groundwater contamination, NORM accumulation, stormwater overflows, sludge buildup. TRRC Rule 8 updates in 2001 and 2007 ended unlined pits.
Era 2: Lined Pits + Basic Mechanical Separation (2008–2014)
Horizontal drilling boomed, pushing flowback volumes to 40,000–80,000 barrels per well in the first 30 days.
Operators switched to HDPE-lined pits, three-phase separators, skim tanks, and occasional portable centrifuges.
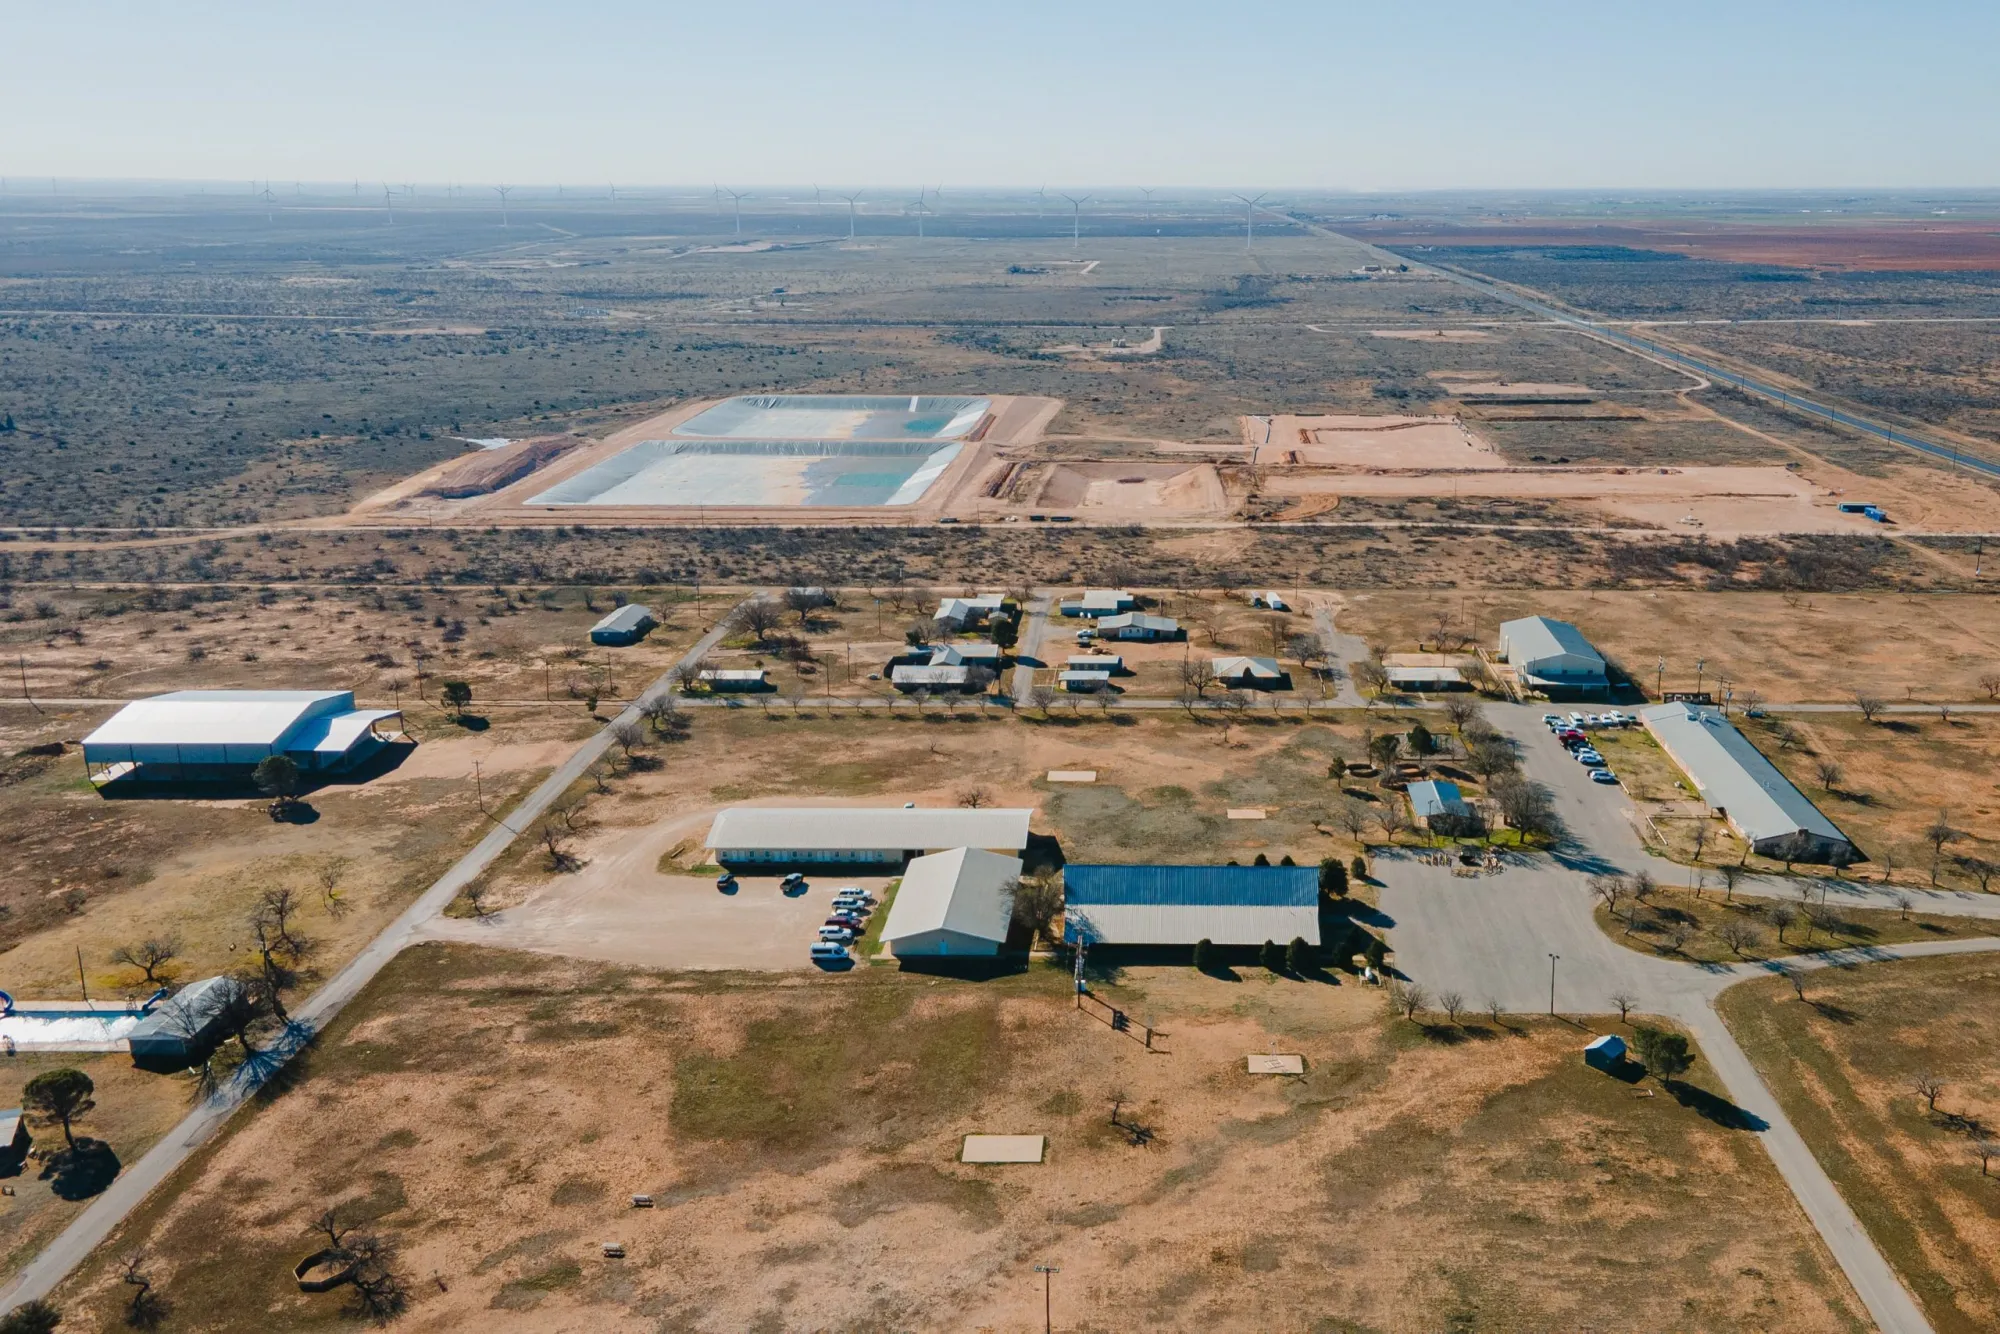
Disposal was cheap ($0.15–$0.30/bbl), so focus was "get it out of the way" — not optimization.
Era 3: Centralized Facilities + Early Chemical Treatment (2015–2020)
2014 oil crash + seismicity issues forced change. Midstream built pipelines and centralized facilities.
Chemical programs emerged: inorganic coagulants, oxidation, scale inhibitors, and basic anionic PAM.
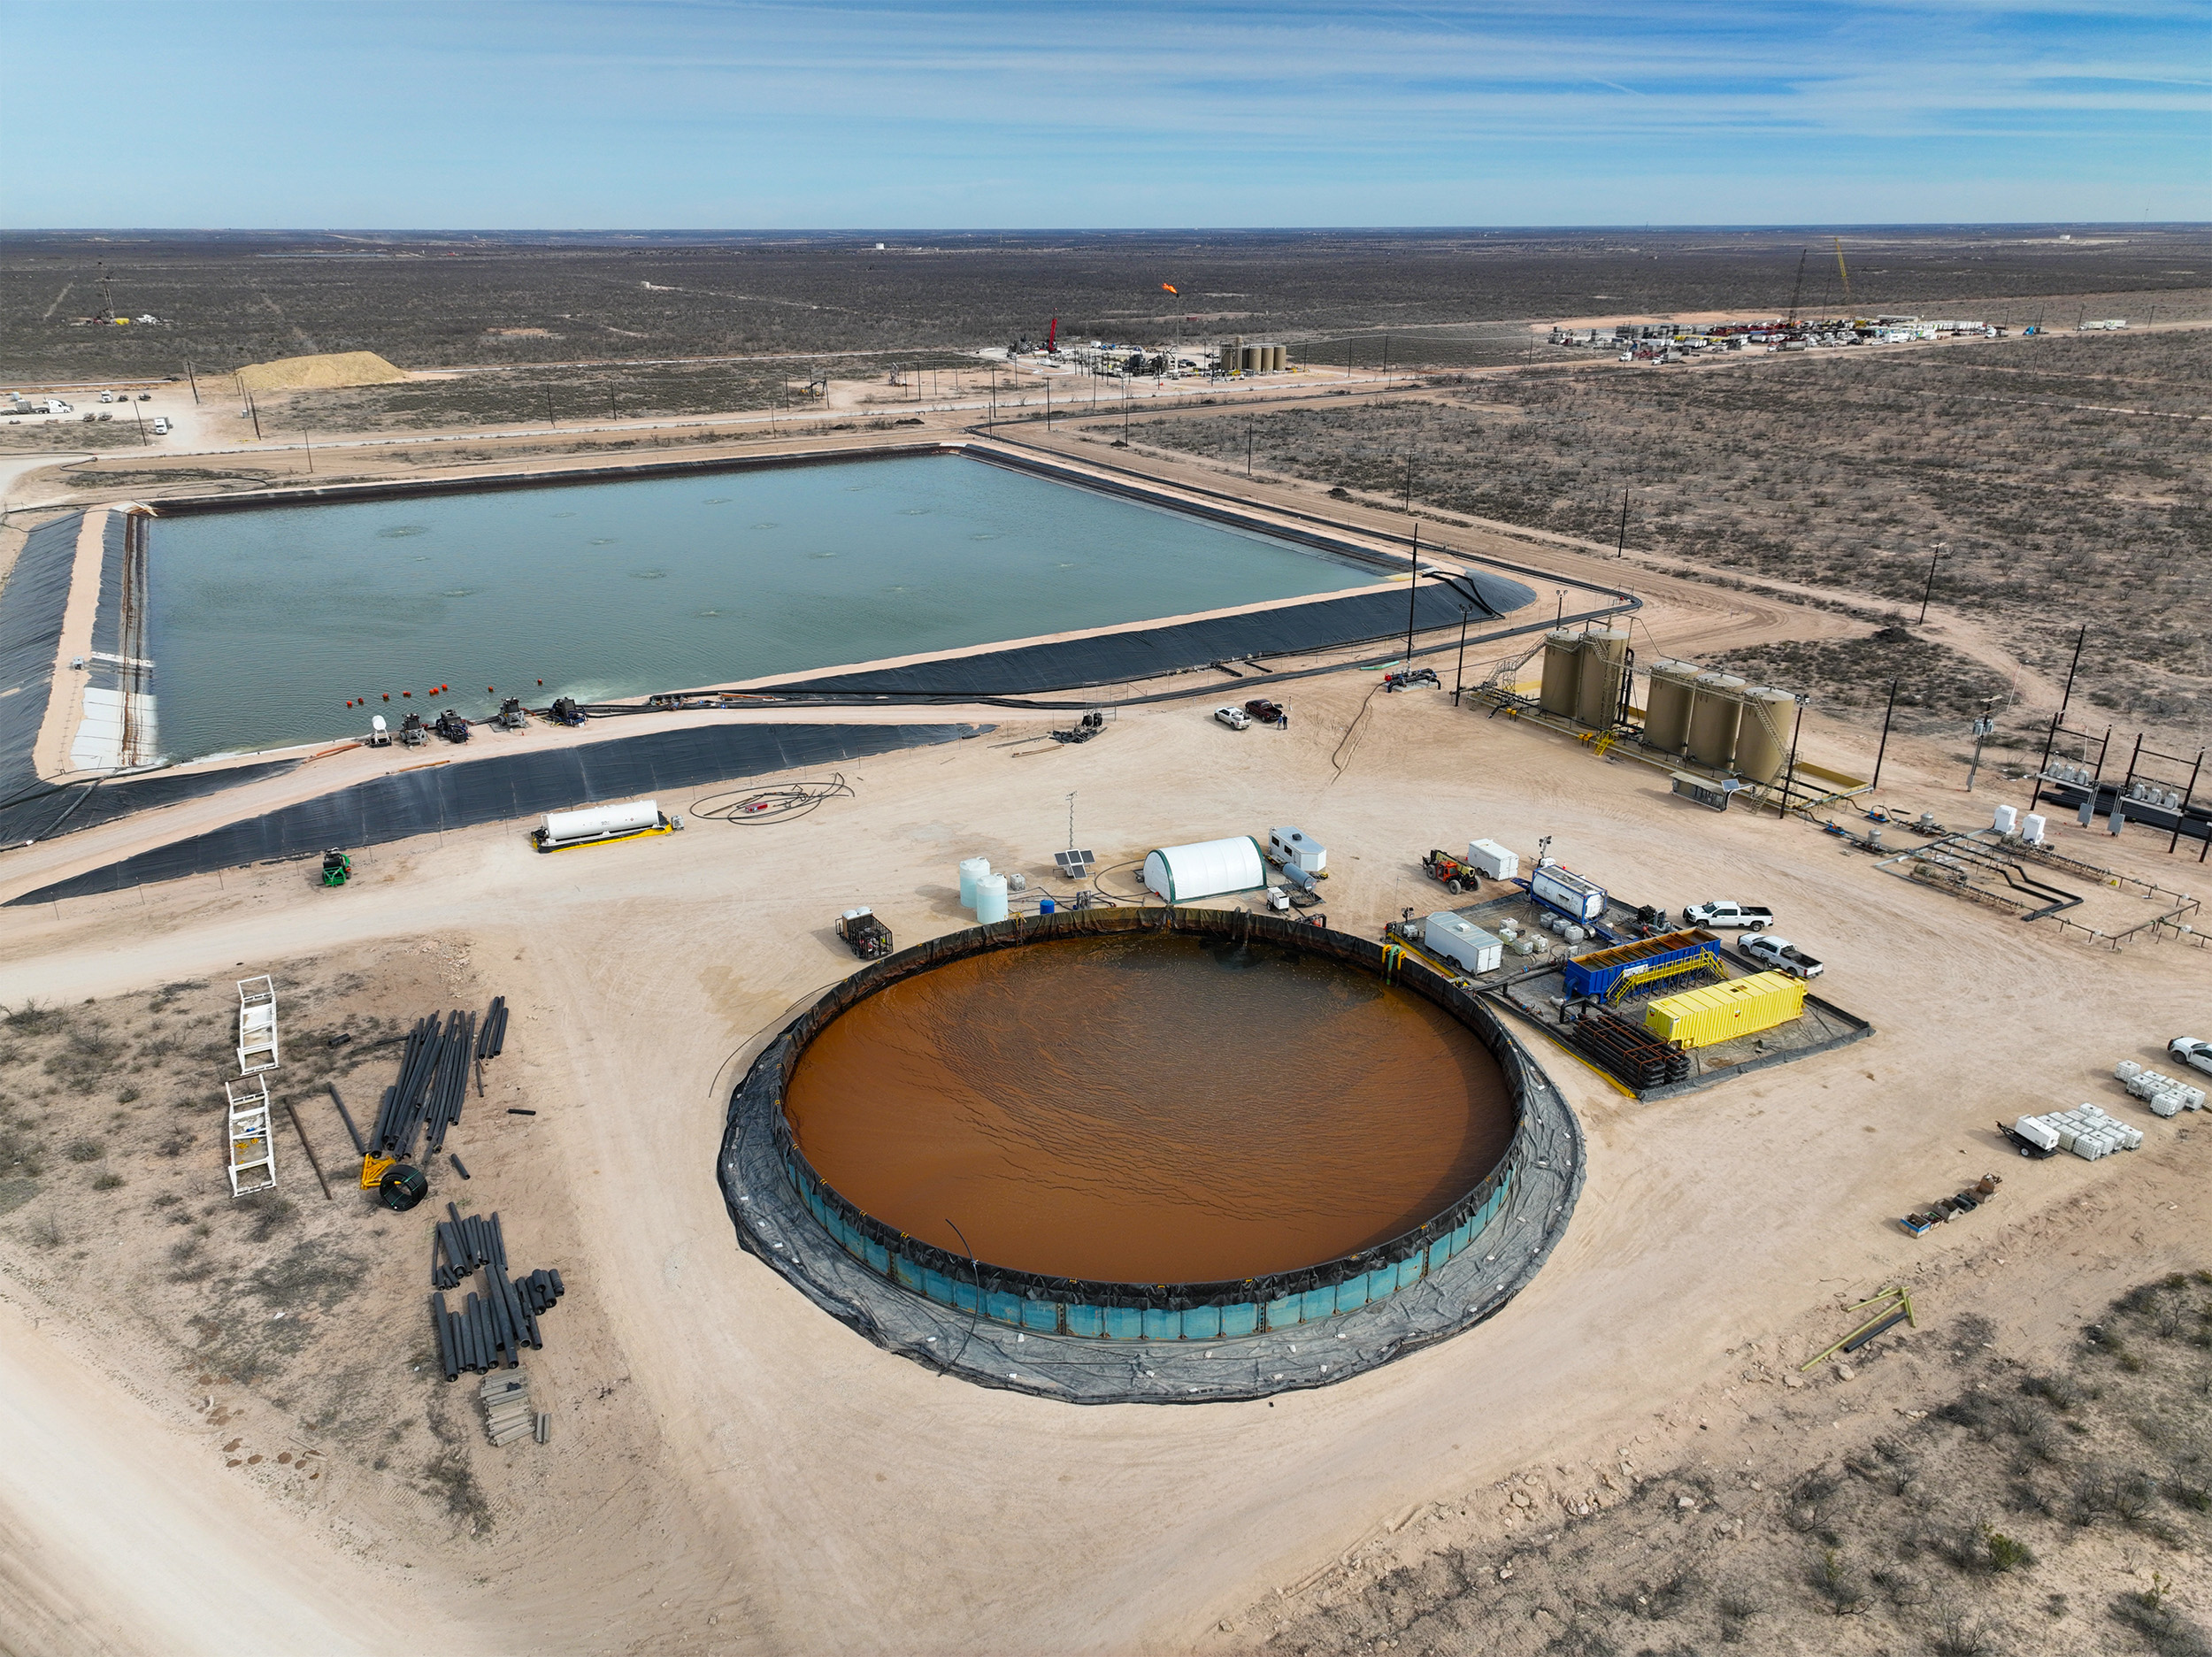
Performance improved, but commodity anionic PAM struggled in high-TDS water. TSS removal often 60–75% — not optimal.
Legacy vs. Current Approach: Direct Comparison (2026)
| Parameter | Open Pit Era (Pre-2008) | Lined Pit + Mechanical (2008–2014) | Centralized + Basic Chemistry (2015–2020) | Optimized Polymer (2021–2026) |
|---|---|---|---|---|
| TSS Removal Efficiency | 25–45% | 45–60% | 60–75% | 90–98% |
| Sludge Dry Solids Content | < 2% | 2–4% | 4–8% | 12–22% |
| Treatment Cost ($/bbl) | $0.15–0.35 | $0.25–0.55 | $0.45–0.85 | $0.55–$0.95 (reuse offset) |
| Reuse-Ready Water | No | No | Rarely | 70–85% |
| Sludge Volume (per 100k BPD) | Unmanaged | 450–700 wet tons | 280–450 wet tons | 80–150 wet tons |
| Regulatory Compliance | Non-compliant | Partial | Partial | Full TRRC + EPA |
Sludge reduction alone saves mid-size facilities $8M+ per year.
CPAM in 2026: Why Polymer Selection Is a Core Engineering Decision
Top operators now treat cationic polyacrylamide (CPAM) as engineering priority — not commodity.
Flowback fines carry negative charges. Anionic PAM needs extra coagulant and fails in high-TDS. CPAM's positive charge neutralizes particles directly, building dense flocs fast.
Benefits:
- Faster settling
- Higher TSS removal at lower doses
- Drier sludge
- Lower overall costs
Jar testing with real samples yields 20–35% better performance. In polyacrylamide technology, proper CPAM selection is now competitive edge.
As volumes rise, operators who engineer flowback treatment win big.
In our next article we will dive deeper into sludge dewatering — the final critical step that turns these polymer systems into real cost savings and reuse success. <!-- seo-depth-expansion -->
Field Verification Worksheet
For Evolution of Fracking Flowback Treatment in the Permian Basin, record the water source, sample time, barrels per day, temperature, pH, conductivity or TDS, total suspended solids, iron, oil and grease, and any upstream chemical change during the acceptance test. Tie every sample to tank level, separator condition, filter differential pressure, and injection or reuse destination. That context matters because two samples with similar turbidity can behave differently when salinity, oil droplets, oxidation state, or residence time changes during the acceptance test.
At the filter inlet, convert chemical use to a common basis before comparing results. State neat-product density, active content, dilution strength, calibrated pump output, and dose per treated barrel during the acceptance test. At peak flow, reconcile the calculation with tote drawdown over a known operating period. A field recommendation for evolution of fracking flowback treatment in the permian basin is not complete until the dose, water quality, sludge volume, filter response, and downstream operating effect can be reviewed on the same timeline during the acceptance test.
Acceptance and Supply Gate
At the water hub, define the pass condition before a full shipment is ordered. The gate may include outlet TSS, filter run time, injection pressure, sludge-hauling volume, pump stability, or compatibility with downstream reuse chemicals during the acceptance test. For field operations, run long enough to cover realistic flow and water-source changes, and preserve the blank or incumbent baseline. An isolated clear bottle is supporting evidence, not the commercial endpoint during the acceptance test.
Before procurement approval, the supplier file for Evolution of Fracking Flowback Treatment in the Permian Basin should include batch identity, preparation instructions, storage limits, packaging, lead time, safety data, and a process for investigating a repeat-shipment change. Operations should also document stop criteria for oil carryover, H2S risk, off-spec water, failed containment, or feed-pump drift during the acceptance test. During source blending, these controls make the article's recommendation auditable by both field staff and procurement.