Let Me Tell You What I Actually See in the Field
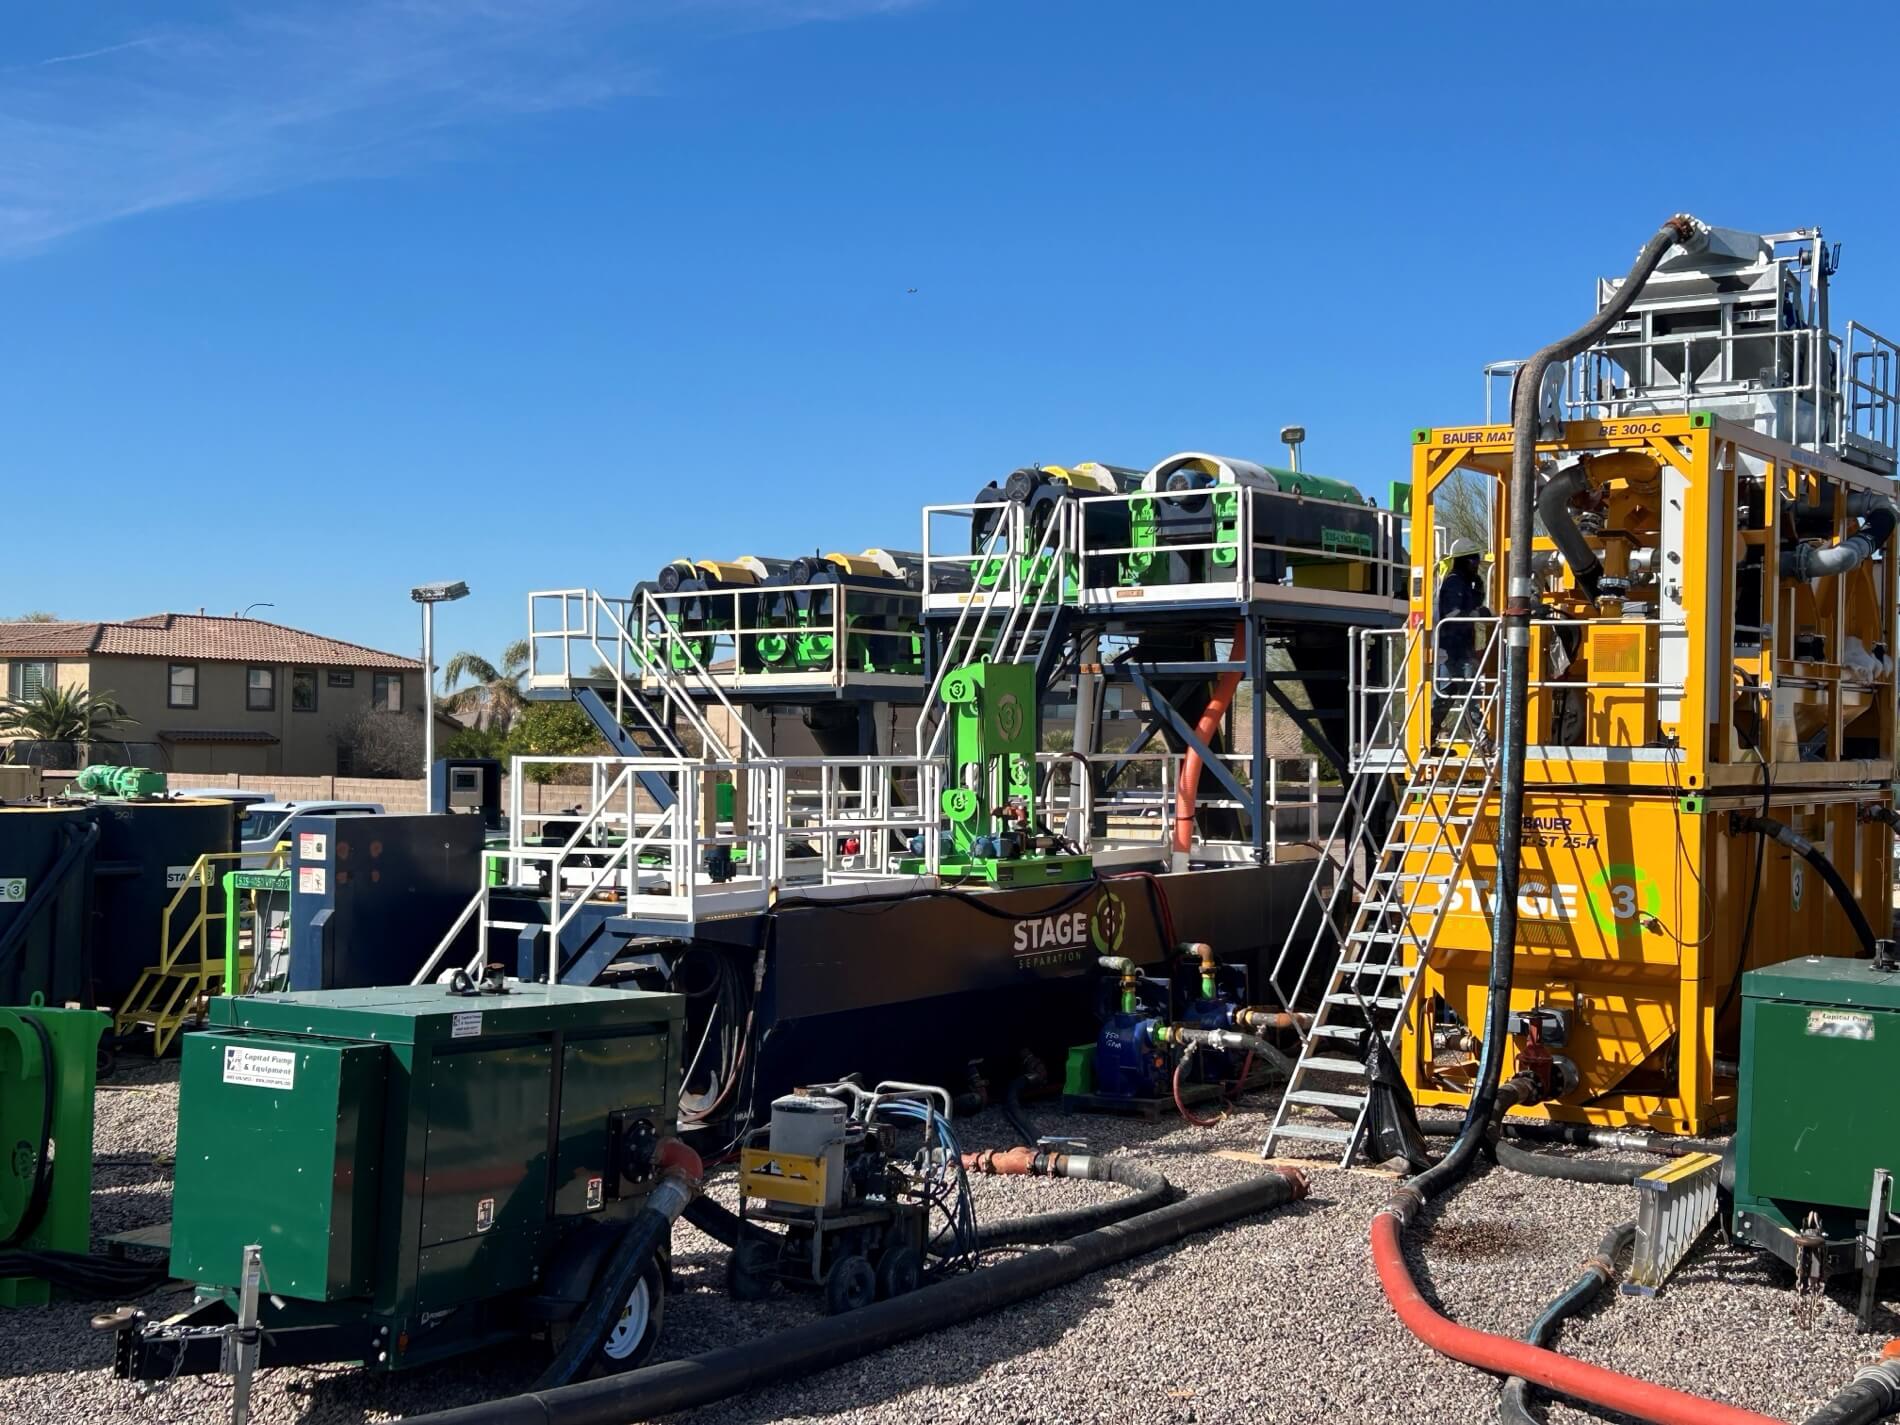
Here is something I have watched happen more times than I can count across 18 years working Permian Basin water handling facilities. An operator reaches out — costs are spiraling, filter presses are blinding every four hours, vacuum trucks are running shifts around the clock, and the plant supervisor is getting calls from the field manager every morning asking why the sludge lagoon is filling up again. We come out, walk the facility, look at everything. Then someone hands us the polymer spec sheet.
Generic anionic PAM. Medium molecular weight. Purchased off a chemical distributor price list based entirely on cost per ton.
And honestly, I get it. When you are staring at a water management cost line that has ballooned to 22% of your total LOE — which, as we covered in our earlier piece on how Permian Basin produced water volumes have reshaped operator economics, is now a reality for a significant portion of Delaware and Midland Basin operators — the procurement team is going to gravitate toward whatever saves money on paper. The problem is that the cheapest polymer and the right polymer are almost never the same thing in Permian Basin conditions. And the gap between those two options is costing operators a lot more than the price difference on the spec sheet.
This article is about what the cost savings from properly optimized polyacrylamide programs actually look like in practice, based on real facility data from 2025 and 2026 operations. Not theoretical projections. Real numbers from real plants.
The Misunderstanding That’s Still Costing Money in 2026
Here is the mental model that a lot of production engineers still carry around: polyacrylamide is polyacrylamide. It’s a flocculant. You add it to water, stuff settles out, you move on. The molecular weight and charge density are secondary variables you tweak after the fact if things aren’t behaving perfectly.
That framing might have been forgivable fifteen years ago when Permian Basin treatment volumes were a fraction of current levels and SWD disposal capacity was cheap and abundant. It is not forgivable in 2026. As we detailed in the evolution of fracking flowback treatment in the Permian Basin, the water chemistry profiles coming off Delaware Basin completions — TDS values pushing 200,000 mg/L, TSS concentrations that can spike to 15,000 mg/L or higher during early flowback — create a treatment environment where the wrong polymer does not just underperform modestly. It functionally fails. You are running your equipment, consuming your chemical budget, and achieving TSS removal rates of 55 to 65% when an optimized cationic polyacrylamide program in the same facility should be returning 90 to 96%.
That 30-percentage-point performance gap is the difference between a treatment system that works and one that just looks like it works while burying costs downstream in your sludge handling budget.
 Markdown
Case Study 1: Delaware Basin Operator, Reeves County, 2025
Last year, we did a polymer optimization review for a mid-size independent operating about 185,000 BPD of combined produced water and fracking flowback through a centralized treatment facility in Reeves County. Their water chemistry was textbook Delaware Basin: average TDS around 195,000 mg/L, calcium at roughly 18,000 mg/L, incoming TSS ranging from 800 to 4,500 mg/L depending on how many active completions were feeding the system that week.
They had been running a commodity anionic PAM at 12 to 18 mg/L dose rates, combined with an inorganic coagulant pre-dose. It was producing clarifier effluent at 180 to 350 mg/L TSS — borderline acceptable for their SWD injection filters — and a sludge underflow at about 3.8% dry solids content. They were pulling sludge with vacuum trucks every 14 hours and running two filter presses in continuous rotation with cycle times of around 3.5 hours. Belt blinding was a persistent problem; media wash cycles were eating into net throughput capacity by about 30%.
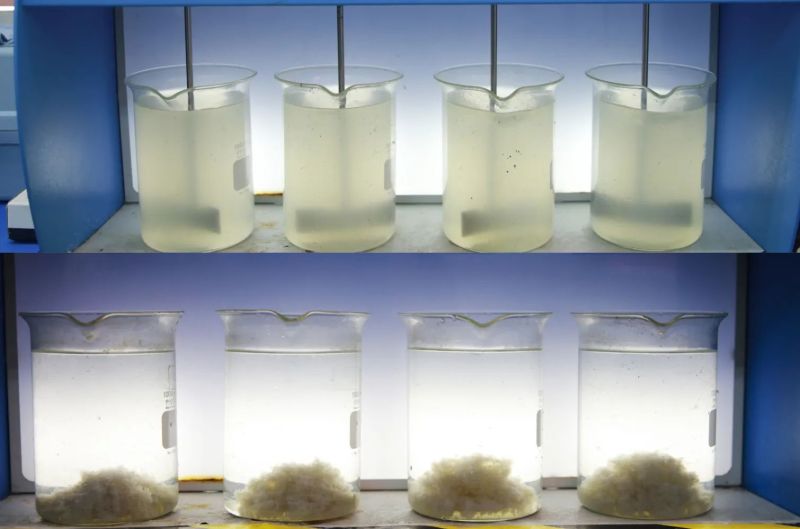
We ran jar testing on representative samples — both the clarifier feed and the sludge underflow — and matched them to a cationic PAM at approximately 55% cationic charge density and molecular weight in the 12 million Dalton range. Optimized dose settled at 9.5 mg/L — lower than what they had been using, which surprised the plant manager.
The results after 60 days of optimized operation:
- Clarifier effluent TSS dropped to 45 to 90 mg/L — reliably below their SWD injection filter specification
- Sludge underflow dry solids increased from 3.8% to 17.2%
- Filter press cycle time extended from 3.5 hours to 6.5 hours
- Belt blinding incidents dropped from roughly 22 per month to 3
- Daily vacuum truck runs: down from 11 to 4
The operational math on vacuum truck costs alone — at $1,800 per run including driver and transport — was $13,140 per day at their previous rate versus $7,200 per day after optimization. That is $215,000 per month in direct trucking cost reduction from changing the polymer selection and dialing in the dose. Their filter press maintenance costs dropped by an estimated 40% over the following quarter due to reduced media fouling and fewer emergency interventions.
Case Study 2: Midland Basin Contrast, Midland County, Early 2026
I want to be fair here, because I have also seen operators in the Midland Basin reach for cationic PAM based on advice from someone who worked Delaware Basin exclusively — and get mediocre results that made them skeptical of the whole polymer optimization conversation.
Midland Basin water chemistry is substantially different from Delaware. TDS values typically run 80,000 to 140,000 mg/L, and the clay mineralogy in Wolfcamp Midland completions tends toward lower illite content than the Delaware’s Bone Spring and Upper Wolfcamp intervals. In that lower-TDS environment, a high-charge-density cationic PAM can actually overdrive the charge neutralization step and produce charge reversal in the colloidal suspension — meaning the polymer dose-response curve is more sensitive and the peak performance window is narrower.
One Midland County operator early this year switched to a high-charge-density CPAM identical to a product that had worked well for a peer operating in Reeves County — without running site-specific jar testing — and saw clarifier performance get marginally worse, not better. They called us, we ran samples, and the lab confirmed charge reversal was occurring at the doses they had applied. Switching to a moderate-charge-density CPAM at a lower dose rate solved the problem within two weeks.
The lesson here is not that CPAM is the answer everywhere or that anionic PAM is always wrong. The lesson is that the answer is always specific to the water you are treating, and the jar test is not a formality.
What the Data Actually Looks Like Across Multiple Operators
| Operator Profile | Sub-Basin | Treatment Volume (BPD) | Previous Polymer | Optimized CPAM | TSS Removal Δ | Sludge Volume Reduction | Net LOE Water Cost Savings |
|---|---|---|---|---|---|---|---|
| Mid-size Independent A | Delaware (Reeves Co.) | 185,000 | Generic anionic PAM, 14 mg/L | CPAM 55% cationic, 9.5 mg/L | +31 percentage points | 62% reduction | $280,000/month |
| Major Operator B (one facility) | Delaware (Loving Co.) | 420,000 | Anionic PAM + high coagulant dose | CPAM 60% cationic, 8 mg/L | +28 percentage points | 58% reduction | $640,000/month |
| Private E&P Operator C | Midland (Midland Co.) | 95,000 | No polymer, coagulant only | CPAM 40% cationic, 7 mg/L | +44 percentage points | 71% reduction | $115,000/month |
| Royalty Trust-Backed Operator D | Midland (Martin Co.) | 140,000 | CPAM (wrong MW, overdosed) | CPAM 45% cationic, matched MW | +19 percentage points | 38% reduction | $95,000/month |
A few things stand out in that data. First, look at Operator C — no polymer at all before the switch, just coagulant dosing. That is still more common than it should be in 2026, particularly among smaller operators who inherited treatment infrastructure from a previous era and have not updated their chemical programs since commissioning. The TSS removal improvement there is massive precisely because the baseline was so poor. Second, Operator D illustrates what happens when you have CPAM in place but the wrong formulation — you still get measurable improvement from optimization, but the gain is smaller because you were already doing something right, just not quite right enough.
The Honest Reality About Jar Testing and Why Operators Keep Skipping It
Here is the part that frustrates me. Jar testing a representative produced water or sludge sample takes one to three days of laboratory time and costs somewhere between $800 and $2,500 depending on the testing scope. For a facility running 100,000 BPD, that is essentially a rounding error against the $3 to $6 million annual water chemistry budget.
And yet, in my experience, fewer than 30% of Permian Basin operators run systematic jar tests before selecting or switching polymer programs. Most of them rely on vendor recommendations — which are inherently biased toward whatever product the vendor has in inventory — or they ask a peer in the industry what worked for them, without accounting for the fact that their water chemistry might be substantially different.
As we laid out in the sludge dewatering discussion, the difference between a matched CPAM program and a generic one in high-TDS Permian Basin conditions regularly produces a 3x to 5x difference in net sludge volume — and the downstream cost implications of that ratio compound through every piece of equipment downstream of the clarifier. The jar test is not optional. It is the cheapest insurance an operator can buy against getting the polymer decision wrong.
What a proper jar testing protocol for Permian Basin produced water and fracking flowback conditioning should cover:
- Coagulant type and dose optimization first, before polymer selection
- CPAM charge density screening across at least three candidate formulations
- Molecular weight range testing within the selected charge density
- Dose-response curve mapping to identify the performance peak and the overdose threshold
- Sludge filterability assessment — not just settling rate — using a standardized CST (capillary suction time) or TTF (time-to-filter) method
Doing that work upfront saves the kind of money that makes field managers look good in annual LOE reviews. Skipping it saves $2,000 and costs $200,000 a month.
The 2026 Bottom Line
The Permian Basin’s water management cost problem is structural — we covered that at length in earlier articles on volume growth and flowback complexity. There is no single intervention that solves it. But among the variables that operators actually control on an operational basis, polymer program optimization delivers some of the fastest and most consistently measurable returns available.
Operators who have done the work — jar-tested their specific water, matched CPAM charge density and molecular weight to their feed chemistry, and implemented dose control systems that maintain performance as water chemistry shifts — are achieving 25 to 40% reductions in their net water handling cost per barrel treated. In a basin where that cost line represents $300 to $600 million in aggregate annual spending, that range of improvement means real money, well by well, facility by facility.
The operators who are still running commodity anionic PAM purchased on price, or running no polymer at all and relying on coagulant dose to do work it was never designed to do — they are paying for that decision every single day in vacuum truck runs, filter press downtime, and sludge disposal invoices.
In the next article, we will get into the specifics of how different molecular weight ranges of cationic polyacrylamide actually behave in high-TDS Permian Basin water — why the same charge density at two different molecular weights can produce dramatically different settling rates, and how to read those differences in a jar test before they become a plant performance problem.